Executive Summary
Transparent data is a powerful accelerator of change, encouraging accountability, reinforcing trust, and empowering people to advocate for themselves and others. Transparency is particularly impactful for diversity, equity, and inclusion (DEI) and an answer to the call for companies and organizations to focus on equity, inclusivity and belonging.
The WBC DEI Snapshot is the first of its kind tool which aggregates and analyzes publicly available data on DEI in companies. By collecting and evaluating information in DEI and ESG reports, EEO-1 data and on company websites WBC has analyzed what companies are saying in terms of their commitment and progress in DEI. The goal of our analysis is to determine what information on DEI companies are making public.
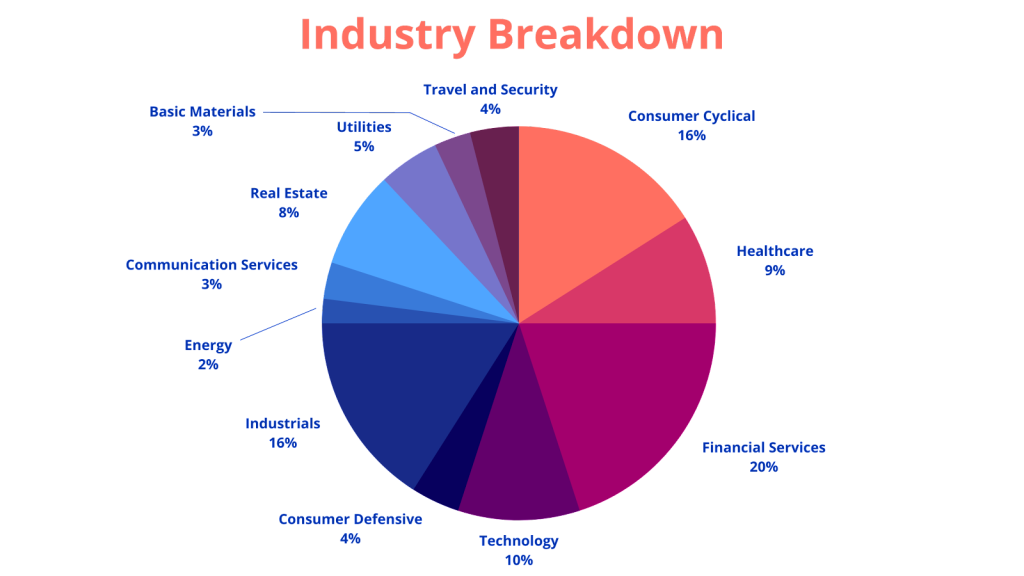
To achieve this goal, Women Business Collaborative (WBC) analyzed a total of 553 companies: across 28 metrics focused on DEI and where and how companies are publishing information on their commitments. The companies assessed included the Fortune 500 companies, as well as 53 randomly selected public and private companies from other indices.
Our analysis found that, as of November 2022, almost 90% of the companies in our dataset publicized at least some data around gender and diversity of their workforce, with almost half (47%) publishing their full EEO-1 report. The EEO-1, mandated by the EEOC, is an annual data collection requirement for all employers with 100 or more employees to submit demographic workforce data, including data by race/ ethnicity, sex, and job categories.
Key around transparency include:
- 34% published a separate DEI Report.
- 47% published their EEO-1 reports.
- 84% included DEI in their CSR or ESG/Sustainability report.
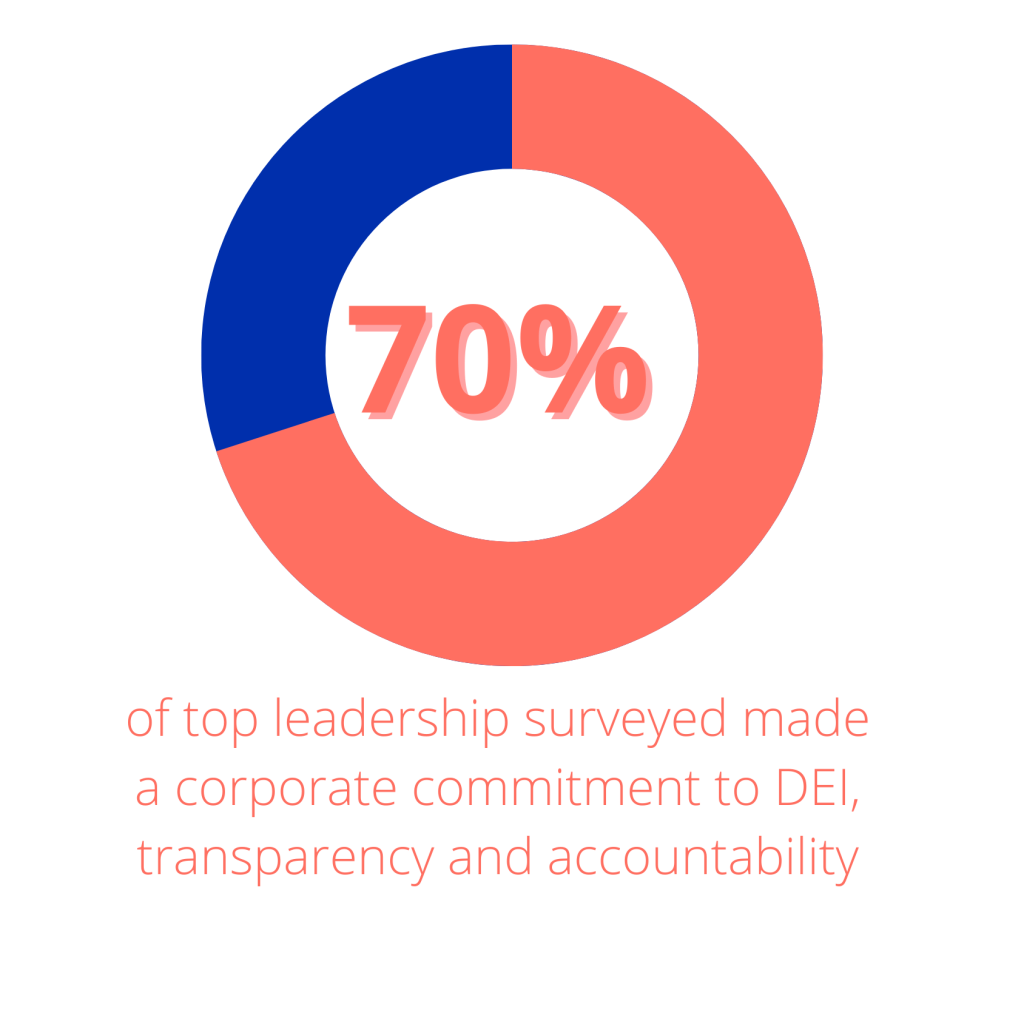
- 70% of CEOs made a public commitment to DEI.
- 47% stated DEI in mission/vision/values.
- 53% stated DEI goals.
The analysis also measured how companies indicated they are doing in terms of: leadership and company commitment to diversity, equity and inclusion; workforce composition; leadership and development; pay equity; recruitment, retention and promotion; supplier diversity; and social impact.
Of the 553 companies analyzed, WBC found the following:
- 77% tracked employee diversity.
- 65% broke out data by demographic.
- 51% broke out data by gender and race (intersectional).
- 77% provided leadership development specifically for women, including mentorship.
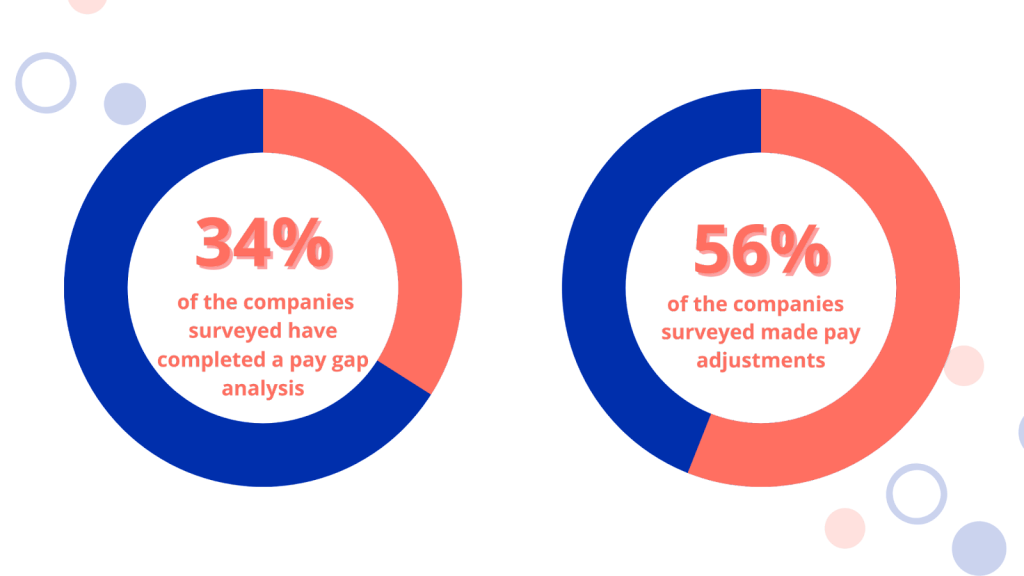
- 32% conducted pay equity assessments.
- 7% tied executive pay to DEI.
- 40% had debiased hiring and promotion procedures.
- 47% directly sourced talent from underrepresented groups.
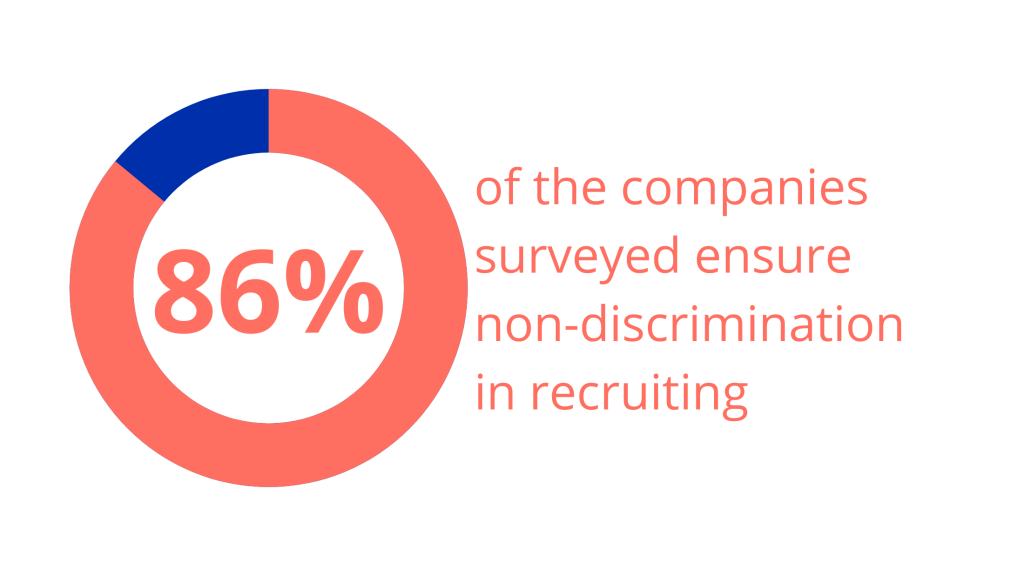
- 86% practiced non-discriminatory recruiting.
- 22% published employee engagement survey results.
- 30% tracked supplier diversity spend.
- 37% engaged in social impact that benefit women.
- 10% published the amount of philanthropic dollars towards women’s causes.
Background
Shareholders, consumers, and employees are increasingly looking for companies to be more transparent in their workforce demographics, pay, and other DEI measures. Pledges and commitments are no longer enough. Companies need to walk the talk.
Recently, some proxy statements have begun including diversity data – a measure of its importance in the markets. These demands for transparency will only increase in the coming years as more companies disclose their data and peer pressure mounts.
In response to these growing trends and to the increasing need for greater DEI transparency, Women Business Collaborative (WBC), partnered with Gender Fair and the University of New Haven Pompea College of Business (UNH) to commission a groundbreaking project to investigate transparency around DEI reporting. The project researched DEI reporting of 553 companies from the Fortune 500, and from 53 randomly selected public sector and private companies. Using only public data from companies’ websites and corporate reports, the team assessed the companies on transparency and other DEI metrics (see Appendix A). The team collected 28 raw data points, ranging from highly generalized data (e.g., whether a company has a stand-alone DEI report), to very specific data (e.g., dollars or percentage of total dollars spent on diverse suppliers, by category). The researchers analyzed not just the reports themselves, but also the accessibility of this information on the company’s website.
This briefing document includes an explanation of:
- The Methodology Behind the Research
- How Transparent Each Company Is
- Best practices
- Key findings and insights
This research is aligned with WBC’s action initiatives, aimed to measure progress against our targets and the importance for all companies and organizations to:
- Demonstrate commitment regarding DEI.
- Increase the number of women on Boards, in the C-Suite, and in technology roles.
- Work towards full gender and pay parity.
- Support equal access to capital for women.
- Ensure all women in the pipeline receive the support to grow and thrive.
Metholodology
This study included 553 companies: all the companies in the Fortune 500 plus 26 S&P 500 companies, 7 Russell 3000 companies and 20 private companies. The 53 companies outside the Fortune 500 were randomly selected. All companies were measured against the following categories of transparency:
- CEO Commitment to DEI
- DEI as part of Mission/Vision/Values
- Diversity Progress tied to Executive Compensation
- Stated Goals for DEI
- DEI Tracking and Reporting including EEO-1
- Leadership Development & Inclusion
- Pay Equity
- Employee Engagement Survey
- Supplier Diversity Reporting
- Women-Centered Philanthropy/Investment
- Recruitment, Retention, and Promotion Practices and Results
The UNH team collected data from each company’s website and then analyzed and scored each company across the 20 metrics based on its transparency in disclosing DEI data.
The team finalized the research at the end of November 2022. The DEI Report Repository includes all publicly available 2021 and 2022 DEI reports and EEO-1 reports, where available. It also contains links to 258 EEO-1 reports, 131 DEI reports, and 383 ESG/CSR reports, as of October 2022.
Findings from this research indicate that disclosure of gender and intersectional data is not consistent across all companies. Some publish their full EEO-1 reports, while others disaggregate data by one or two demographic groups. Without standardized reporting, it is difficult to make comparisons across companies and industries. Nonetheless, several trends and specific initiatives did come to light because of the research, making this brief a valuable resource for where we are and where we need to go in terms of achieving greater DEI transparency.
Detailed Findings
Leadership Commitment
- 70% of CEOs of companies surveyed made a public commitment to DEI efforts. Many also made commitments to transparency and accountability.
- 47% explicitly stated that DEI was a strategic business priority within their organization’s mission, vision and values.
- 53% of companies made a future commitment related to specific DEI goals.
- 7% included executive pay or bonuses tied to diversity goals (including on proxy statements).
Workforce Composition
- 34% of the companies surveyed produced a DEI report. Of companies not publishing a separate DEI report, 84.4% published DEI data elsewhere, including in their CSR/ESG report.
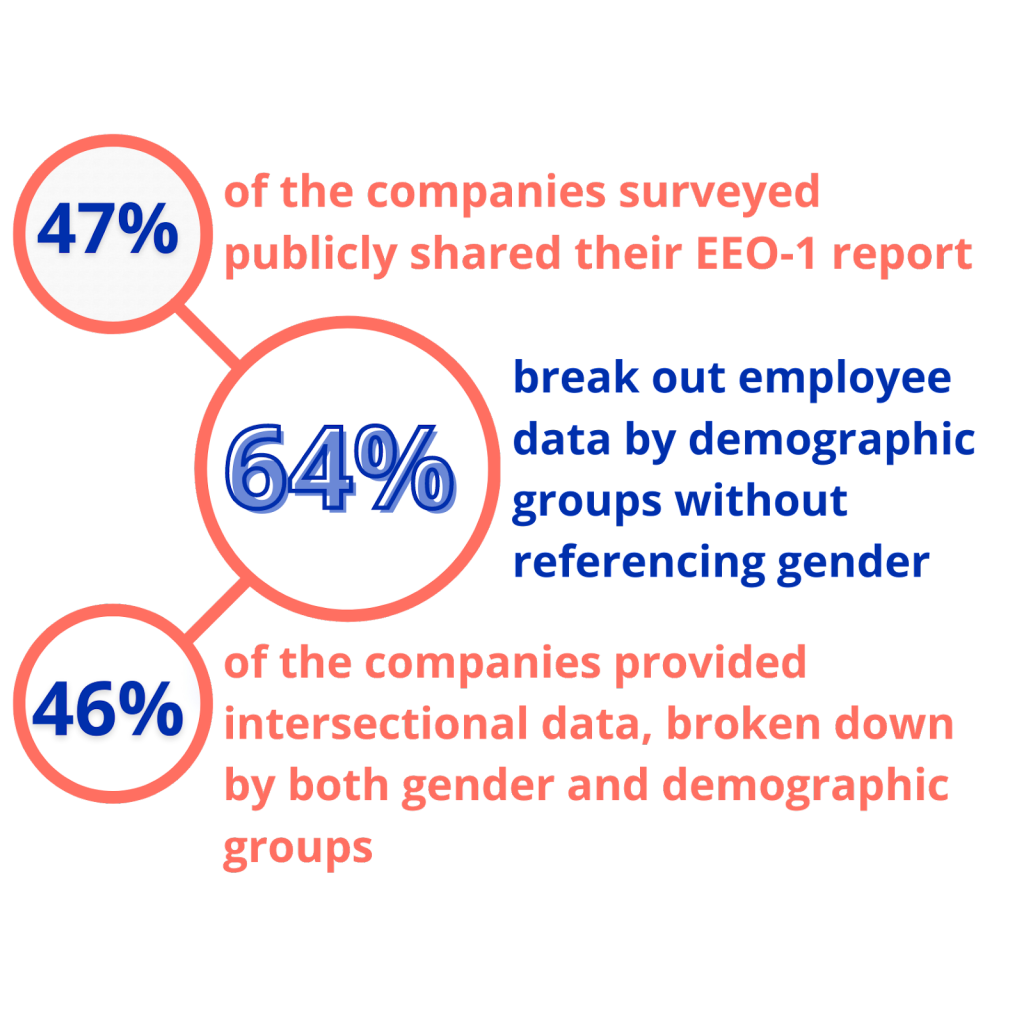
- 47% publicly shared their EEO-1 report.
- 64% break out employee data by demographic groups without referencing gender, whereas 49% of the companies provided intersectional data, broken down by both gender and demographic groups.
- 76% reported that they track employee diversity.
Leadership Development & Inclusion
- 76% of the companies surveyed provide access to leadership development programs for women, including mentoring.
- 58% have networks for women, such as ERGs and/or mentoring.
Pay Equity
- 30% of the companies indicated they conduct regular independent pay equity analysis, publish any gaps and ensure adjustments are made to close those gaps.
Recruitment, Retention and Promotion
- 40% of companies surveyed have hiring processes that remove biases, such as diverse candidate slates and interviewers, anonymized reviews and standardized interview questions. Several companies see non-traditional backgrounds and experience as equivalent to education.
- 86% ensure non-discrimination in recruiting and 46% actively recruit and partner with underrepresented associations and colleges.
- Many companies measure and publish involuntary and voluntary turnover, by gender and race/ethnicity.
Supplier Diversity
- 30% of the companies assessed shared their supplier diversity spend. Most provided spend in terms of amounts, broken down by group, with many including percentages.
- 37% engage in social impact that benefit women.
Employee Benefits
- Most companies provide competitive benefits for employees with the majority covering paid family leave, mental health support, flexible work hours and backup childcare.
- 5% of companies state that they will cover reproductive healthcare.
Community – Philanthropy/Investment
- 37% of the companies assessed have social impact initiatives that benefit women and girls, including women of color outside the company. Of those, 8 % report the dollar amount in which they invest in these initiatives. Most programs are related to investing in STEM education, health and financial wellness/equity.
- Advocacy was mostly related to racial equity with a few companies advocating for federal paid family leave.
Scorecard for Transparency
WBC, along with Gender Fair and UNH, created a scorecard based on 20 of the metrics. The scoring rubric for transparency and broader metrics are both annexed to this briefing. (Annex A and B) Based on this rubric, 10% of companies are “Transparent” or “Very Transparent” when it comes to Gender Equality & DEI.
Scoring Value System
[table id=2 /]
The top four “most transparent” Industries include commercial banks, financial data services, chemicals and pharmaceuticals.
[table id=3 /]
What Sets Best Practice Companies Apart?
In addition to transparency, the research sought to gain perspectives on over-all progress in implementing DEI actions and initiatives among the surveyed companies. A number of companies self-reported on incorporating best practices to actively advance DEI. Among them:
Procter & Gamble: The company has spent $1 billion with women-owned businesses. P&G leverages their massive spending and voice in media through an accurate portrayal of women and girls – to create culture change around the world. Every brand has a purpose – mostly related to women’s empowerment (e.g., Always Sanitary Napkins to keep girls in school). P&G also demonstrates its transparency with strong gender balance in leadership and with generous benefit packages, including equal parental leave for fathers and mothers.
IBM: The company requires accountability for leaders as outlined in IBM’s 2022 Proxy Statement: “to measure our executives globally in their annual incentive program with a modifier for diversity results.” Additionally, they are strong advocates for federal paid family leave and reentry programs after career breaks.
Citi: The company discloses both adjusted and unadjusted pay gaps. They leverage diverse interview slates and 41% of positions are filled with internal talent. Citi uses its corporate voice for advocacy to effect social change – racial, pay equity, gun control, immigration, and LGBTQ issues. They provide generous benefits including sabbatical programs and encourage their top suppliers to publish their ESG reports.
Coca-Cola: They doubled their spending with minority owned media companies. 10% of spending ($10.9M) went towards women’s empowerment contributions. Their foundation enabled the economic empowerment of more than 6 million women.
HP: Working to achieve greater equality in their “ecosystem,” they require that 10% of HP supplier account team members be black. HP provides reverse mentoring on culture/DEI with board members and executives. HP also recently reported their CEO pay ratio against their median employee’s annual total compensation (306:1). Additionally, employees receive financial incentives for their own well-being activities/lifestyle.
Intel: The Equal Employment Opportunity Commission (EEOC) does not require employers to file EEO-1 pay data, but Intel believes it is important to disclose it publicly. “We must be transparent with our data to hold ourselves accountable and encourage industrywide action.”
Bank of America: Their DEI Commitment starts at the top with board and senior leadership reviewing progress. Their CEO has chaired the Global Diversity & Inclusion Council since 2007. Leadership Councils, Employee Networks, and external partnerships ensure accountability. Bank of America offers generous benefits with credit given towards health premium based on active lifestyle. Their employee relief fund supports spousal hardship.
Microsoft:Employees are surveyed twice a year. The focus is on more than just engagement. It is on the employee experience and whether employees are thriving. Tracking is year over year. “We believe transparency fuels accountability and accountability builds trust”. Microsoft has shared pay equity data since 2016 in the US and now globally. The company also prohibits asking candidates their salary histories. Employees are provided with nontraditional career paths in technology and training support. Generous benefits also include coverage outside of restrictive states. (e.g., travel and expense for out-of-state abortion/gender affirming healthcare). Additionally, Microsoft requires suppliers to provide a minimum of 10 weeks paid family leave to their employees.
Uber:They self-ID to include education, and caregiver status. They measure how many positions are filled internally (30%) and offer employees three work options: Fully remote, Hybrid and Work in Office.
Bristol Myers Squibb: They have committed $150M per year to advance I&D and Health Equity. They report on diverse supplier spending by group (women, veterans, disability, LGBT). Their Skills2Give program provides $1Million pro bono services by employees. They are advocates of diverse representation in clinical trials using diverse investigators.
Walmart: The company participates in the Women’s Business Enterprise National Council (WBENC) supporting the outreach and development of women of color. They have increased their hourly wage to $16. Their Supplier Inclusion department states that $13.3 billion in goods and services are sourced from approximately 2600 diverse suppliers. Additionally, they have accelerated receipt of invoice payments for small suppliers to receive payments within 48 hours of submission.
Significant Takeaways
Although there is no standard reporting, we do see common themes that top scoring companies share publicly when it comes to gender equality and DEI. Several companies go to great lengths to define terms for their readers up front via a glossary and to include gender balance race/ethnicity, job categories, median and equal pay for equal work. For example, Microsoft distinguishes population versus representation and defines ethnic and gender categories, across all levels within the organization. Self-identification is a key factor in their data disclosures through voluntary and confidential self-identification of gender pronouns, military status, sexual orientation, race and ethnicity.
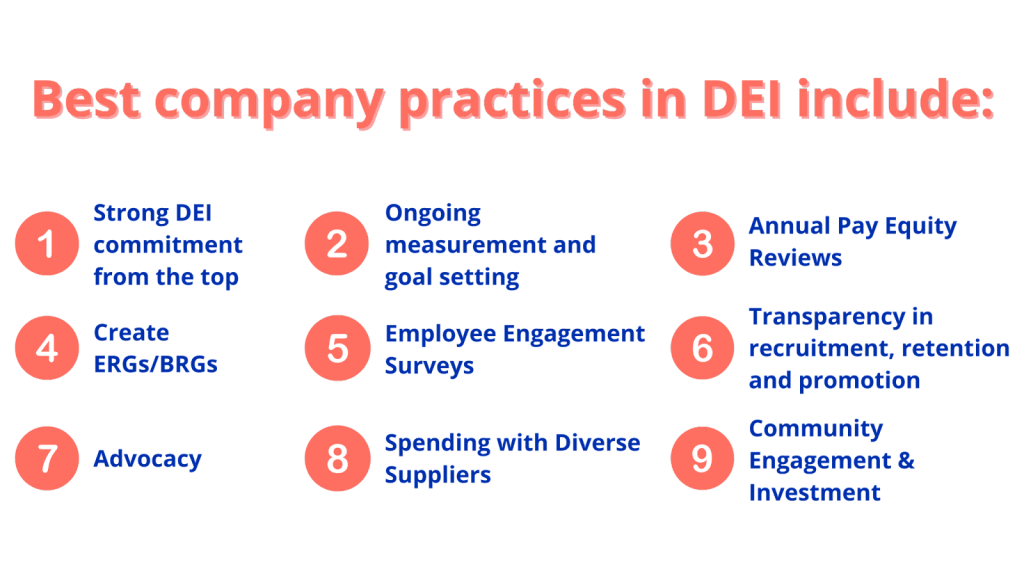
Some other common denominators of best practice companies include:
- Strong DEI commitment from the top: Data transparency and accountability measures are evident through statements from the CEO, included in corporate mission/ vision/values as well as in tying executive compensation to diversity goals. This includes board reviews, publishing data on proxy statements, and other visible leadership commitments and goals/targets.
- Ongoing measurement and goal setting: Many companies are adding new and expanded ways for employees to confidentially self-identify – e.g., multi- racial and gender identities, military status, and disabilities. This workforce data also includes goals to be achieved within a stated timeline. Some are measuring representation and percentage of growth of female and underrepresented groups in the US and globally against population growth. Data includes total headcount, new hires, and turnover categorized by region, by gender and ethnic group, year over year with commitments by 2025 and 2030.
- Pay Equity: Best practice companies conduct annual Pay Equity reviews, many via an independent third party, with adjustments for any pay discrepancies. Often companies share compensation data for internal and external job postings. Several companies reflect total pay to include base plus bonus and stock awards. Also a few companies disclose unadjusted differences in median total pay which is more indicative of representation for women and ethnic minorities in higher earning roles (e.g., Microsoft). Some companies ensure a living wage, and disclose minimum pay for hourly workers (e.g., Walmart). The goal for these best practice companies is ensuring a living wage, while maintaining 100% pay equity through ongoing independent reviews and adjustments between genders globally and in the United States by race/ethnicity.
- Career/Leadership Development: To support DEI goals and create inclusive work environments, best practice companies are increasingly creating ERGs/BRGs or affiliate groups of employees who share commonalities such as gender, race or sexual orientation Among the companies analyzed, more than half have created ERGs. This reflects an important development ERGs are having a positive impact on inclusion and on improving hiring and retention practices. ERGs are also leveraged to reach target customers in corporate marketing efforts. Most companies have instituted robust training for future skills, leadership, mentoring and sponsorship, and are also disclosing the percentage of eligible employees participating in each of these programs.
- Employee Benefits: have increased during Covid, and many were added to include physical and mental well-being support, in addition to paid leave, backup childcare, flexible work and returnship programs. These benefits are now being included within the DEI report, not just on the career/job posting sites. Only 5% publicly share that they will support reproductive and/or gender-affirming healthcare.
- Transparency on Recruitment, Retention and Promotion: These are important metrics including both voluntary and involuntary turnover, and corporate efforts to retain underrepresented groups. Sourcing talent from historically black colleges/universities and associations is a common theme for most companies. Additionally, partnering with community organizations to reach non-traditional talent pipelines such as veterans and the formerly incarcerated is becoming more common; as is providing them with necessary skills and internships. Many companies also disclose the percentage of promotions or open positions filled from within, as filling the pipeline with internal candidates is a strong indicator of investment in its people.
- Employee Engagement: Best practice companies seek and share ongoing employee feedback via employee surveys and then publish participation rates and results year over year. Daily ‘pulse surveys’ to a smaller subset of employees, complement annual engagement surveys. Some companies have created an ‘Inclusion Index’ to share results by gender and race. Participation rates in unconscious bias/conscious and inclusion/ Allyship training and programs are sometimes shared.
- Supplier diversity: Best practice companies engage their ecosystem of suppliers to improve the lives of underrepresented groups by spending with diverse suppliers, many sharing the dollar amount and percentage towards women-owned business (and other groups). Many are members of Billion Dollar Roundtable, a coalition of corporations committed to spending at least $1 billion with women and minority owned businesses. A few companies break supplier diversity spending down by women and minority owned businesses (black, veterans, LGBTQ groups). Best practice companies share year over year growth and future targets for spending within various categories.
- Community Engagement and Investment: Best practice companies focus on a variety of areas including social justice non-profits, economic development, financial literacy, affordable housing and access to capital for black women entrepreneurs. Initiatives most frequently take the form of grants, loans and investments. As related to women and girls, most corporate focus is on STEM education. Many measure both community impact and employee participation in donations (which are matched) and/ or volunteer hours as well as local, national and global support.
- Advocacy: Advocacy efforts are mostly focused on racial equity and/or gender equity. Companies try to influence change by protecting the health, safety and rights of employees and the community they serve. Their support includes voting rights, LGBTQ rights, Dreamers and those with disabilities. A few companies are advocating for federal paid parental leave.
- Publish intersectional data and goals, including new hires, retention (voluntary and involuntary) and promotion from within. EEO-1 is the easiest report to disclose workforce composition. By sharing progress, a company makes a commitment to a diverse, equitable, inclusive environment where employees feel as if they can participate in making improvements and also builds trust.
- Disaggregate the numbers to tell the whole story on diversity & equity by breaking down data by demographic groups. Every individual’s experience is unique, and disaggregating the information allows the company to break down “diversity,” instead of approaching it as a monolith.
- Ensure employees have the access to a confidential way to self-identify, including multiracial options, and breaking down the ‘Asian’ category.
- Disclose pay equity for both adjusted and unadjusted total compensation, leveraging independent 3rd party experts. Consider sharing CEO pay against average median employee comp. Prohibit asking compensation histories.
- Cultivate existing talent. Besides tapping into a broad spectrum of talent, provide development opportunities to promote leadership from within the organization. Best diversity practice companies don’t just attract new talent. They retain current staff, and measure turnover of gender and demographic groups. These companies track employee survey participation as well as results, year over year, along with training participation rates for eligible employees.
- For external recruiting, leverage affiliate organizations, and historically black colleges, for under-represented candidates, and explore non-traditional career paths requiring higher education. Ensure that both diverse candidate slates and diverse interviewers are part and parcel of the recruitment and interviewing process.
- Disclose spending with diverse suppliers by each demographic group, not just a total number or percentage. Include breakdowns by the percentage of total spending and compare year over year, with target Leverage the power of corporate procurement by encouraging suppliers to share their ESG data to accelerate transparency and accountability.
- Be specific on employee benefits, including paid time off (in weeks), hourly wage (dollars per hour), as well as participation rates (e.g., paternity leave)
- Encourage employees to participate in the community via matching donations and volunteerism. Track participation and dollars donated. The more engaged employees are with causes of their choice, the happier and more productive they will be, resulting in higher retention.
Conclusion
As we reflect on the past year, it is safe to say that 2022 continued the trend of transparency and accountability among corporations that are finding new ways to improve their DEI efforts. Despite the challenges of the Great Resignation, staffing shortages, ongoing COVID and an uncertain economic future, best practice companies continued to prove that DEI is a strategic business priority, and pressed even more to connect with their employees and the communities they served. Their efforts have not gone unnoticed, with these exceptional companies taking a front seat in inspiring others to do better.
Looking at 2023 and the years ahead, we are confident that more and more companies will embrace DEI as part of an integrated strategy and business imperative. The facts, figures and findings that have come to light as a result of the original research detailed in this brief support that optimism:
- More companies are becoming increasingly transparent in reporting their DEI initiatives and practices. As a result, they are holding themselves accountable both internally and externally and are also providing benchmarks for others to adapt to their own organizations.
- Based on this analysis of what organizations are publicizing, we are seeing more practices come to light that are in tune with the needs of diverse employees and under-served populations including women, people of color, those of various ethnicities, the LBGTQ community, veterans and people with disabilities.
- As more companies “walk the talk,” attracting, retaining and promoting women at all organizational levels is likely to take a stronger hold.
- Previous empirical and anecdotal research has shown that for DEI initiatives to have a solid footing, they must have the whole-hearted support of CEOs and top management. The research reported in this brief shows more CEOs are spearheading DEI efforts and requiring buy in at all organizational levels.
However, while significant strides are being made, this snapshot of DEI in 553 companies also points to how much more needs to be done. Companies across the public and private space must be more forthcoming in sharing information about their DEI efforts so their management, their boards, their employees and all their stakeholders know where they are and where they need to go.
Transparency, while crucial, is only one piece of the DEI story. With its unwavering commitment to DEI, Women Business Collaborative (WBC) will continue to be at the forefront of monitoring not just what companies say they are doing, but what they are doing and how they are doing it. True to our own commitment to transparency, we will share our efforts and initiatives through a variety of communications including briefs, white papers, blogs, and website postings.
We look forward to a corporate landscape where DEI is constantly on the rise!
Acknowledgments
WBC would like to thank all who participated in this project.
WBC is grateful to the all-woman student team at University of New Haven for their research and work measuring the companies against the rubric and metrics. Those students include Elise Browell, Secora Chambers, Briana Van Cleaf, Cora Cogill, Abigail Fleisig, Natalie Jones, Apurva Kandhivanam, Eimy Mena, and Julia Tiso. WBC would also like to thank Dean Brian Kench, WBC Advisory Council Champion Josephine Moran, Professor Leah Hartmann, and Professor John Rosen for their leadership on the project; a partnership between the University of New Haven Pompea College of Business, the UNH Liberty Initiative, WBC, and Gender Fair.
Finally, we’d like to thank Johanna Zeilstra, CEO of Gender Fair and WBC Board Director, and Elizabeth Blockman, Programs and Operations Manager, WBC for leading the project with the UNH students; Amy-Willard Cross, and Rebecca Heaton of Gender Fair, for their support throughout the research process; and WBC interns Trisha Kapur for her support in analyzing and scoring the data and working on the report repository, and Jessica Kweon for her graphics and design work for the website and documents. WBC would also like to thank Chad Capellman and Olivia Frederick for digitizing this briefing and building the Report Repository on the WBC website.